.png?width=187&height=40&name=AppVentory%20Logo%20(White).png)
10 minutes · Needs your accounting platform connected
What you get
A fast view of what your mapped software spend adds up to, how it is changing over time and which applications account for the largest share.
Steps
- Go to Dashboard.
- Read Total App Spend for the last twelve months, and the change on last year beside it.
- Open Spend Over Time for the monthly shape, and the forecast for the next twelve months.
- Scroll to App Spend by Month and Top Applications to see where it concentrates.
- Note your five largest apps. They are a sensible place to start a deeper review because even a small percentage change can matter more at higher spend.
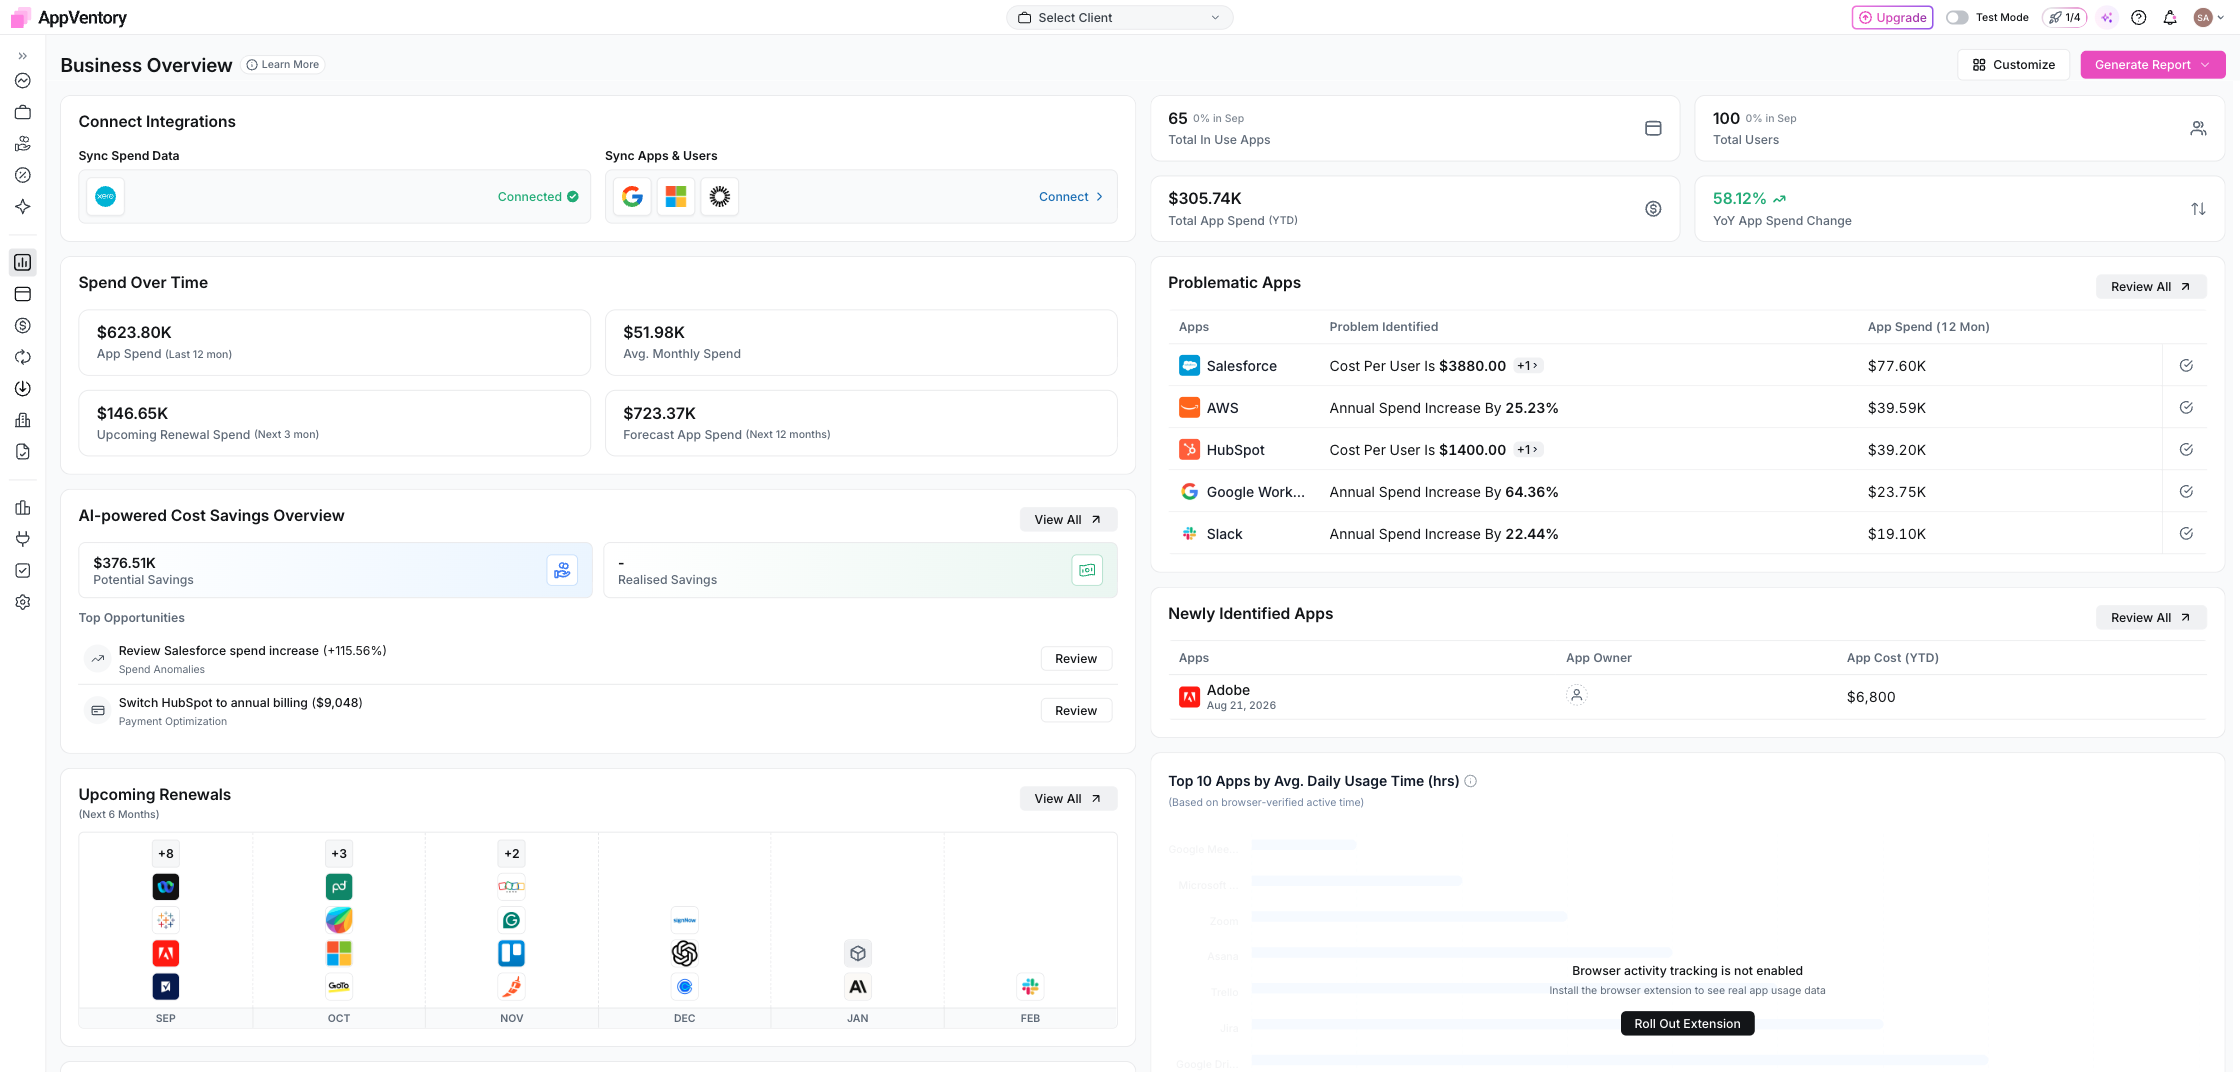
Business Overview dashboard showing total spend and spend over time
What you've found
A current software-spend view and a shortlist of the applications that deserve the first review. Remember that the quality of the total depends on how completely imported transactions have been mapped to the right apps.